Case study
Scope and results
We implemented an integrated central management system for more than 200 exhibition stations, coordinating the exhibition’s multimedia, audio and lighting. All work was carried out while the institution remained open — without closing the exhibition or disrupting visitor traffic. The project included supplying VisionCore graphics servers for large-format projections with 3D mapping across 28 projectors, rewriting several dozen interactive applications, and deploying a visitor behavior analytics module.
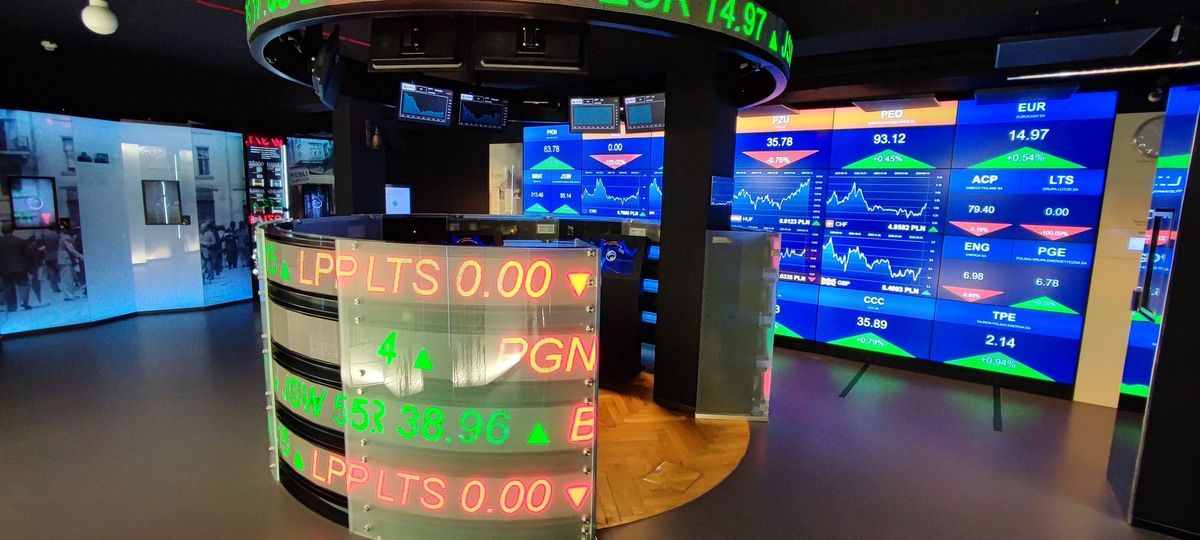
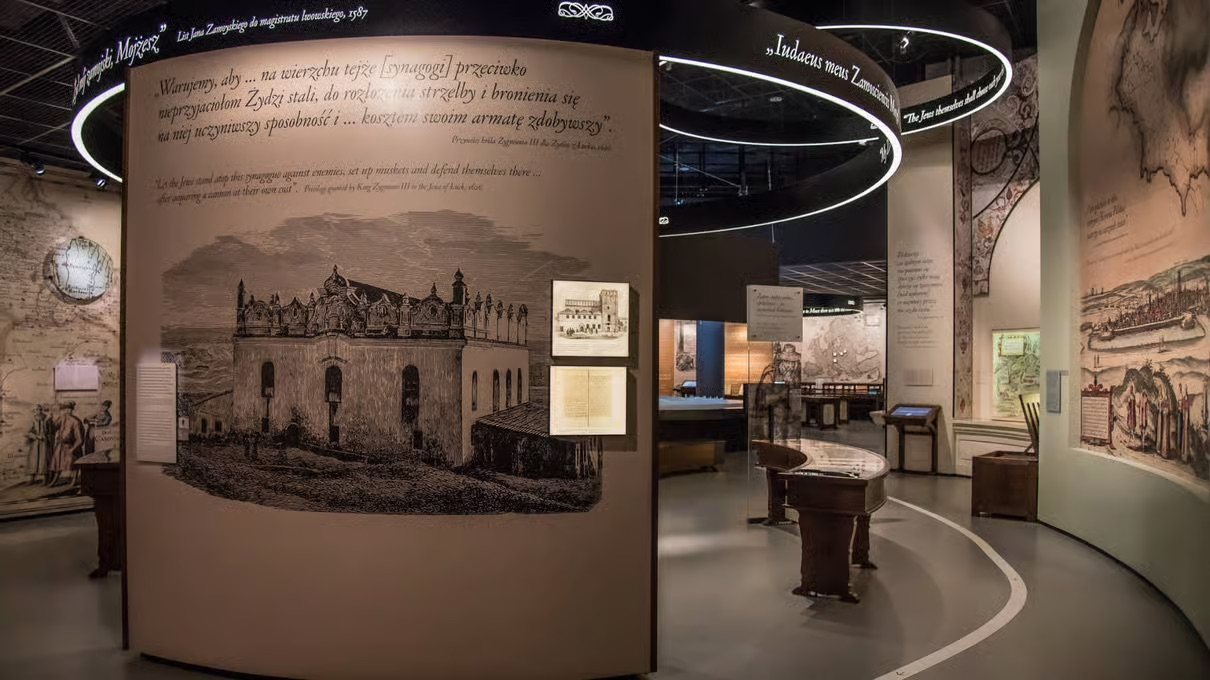
As part of a comprehensive modernization of the POLIN Museum’s core exhibition, we replaced the existing solutions with an advanced, centralized control ecosystem. The new platform ties together more than 200 diverse multimedia and interactive stations, bringing video, multi-zone ambient audio, touch applications and museum lighting control into a single panel.
Deployment without closing the exhibition
We replaced the architecture, installed the servers, deployed the software and migrated the data without taking the exhibition out of service or disrupting the museum’s daily operations. Work and testing were scheduled so that visitors experienced no interruptions at the stations.
Computing power and large-format projections
For the exhibition’s most visually demanding spaces, we supplied and configured dedicated VisionCore graphics servers.
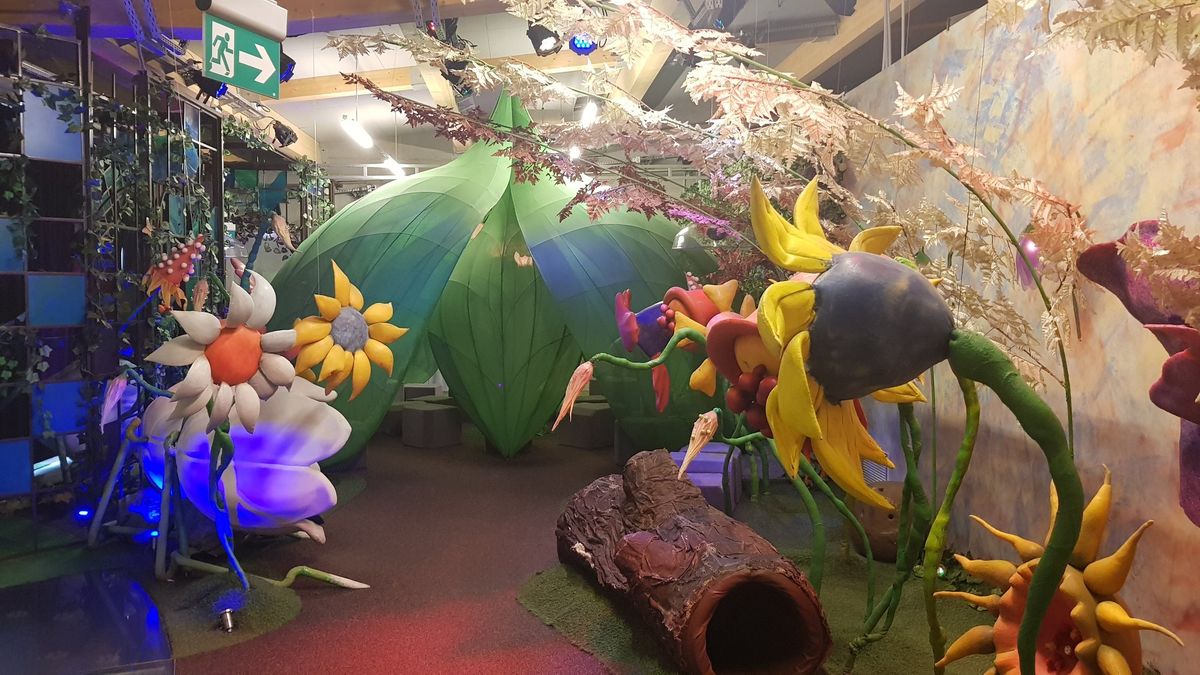
- 3D projection system — 20 projectors: the first server renders and synchronizes in real time a large-format image sent to 20 projectors at their native resolution, delivering 3D mapping onto the scenographic surfaces.
- Supporting zone — 8 projectors: a second VisionCore server simultaneously drives another multi-screen space built on 8 synchronized projectors.
New application architecture and editorial independence
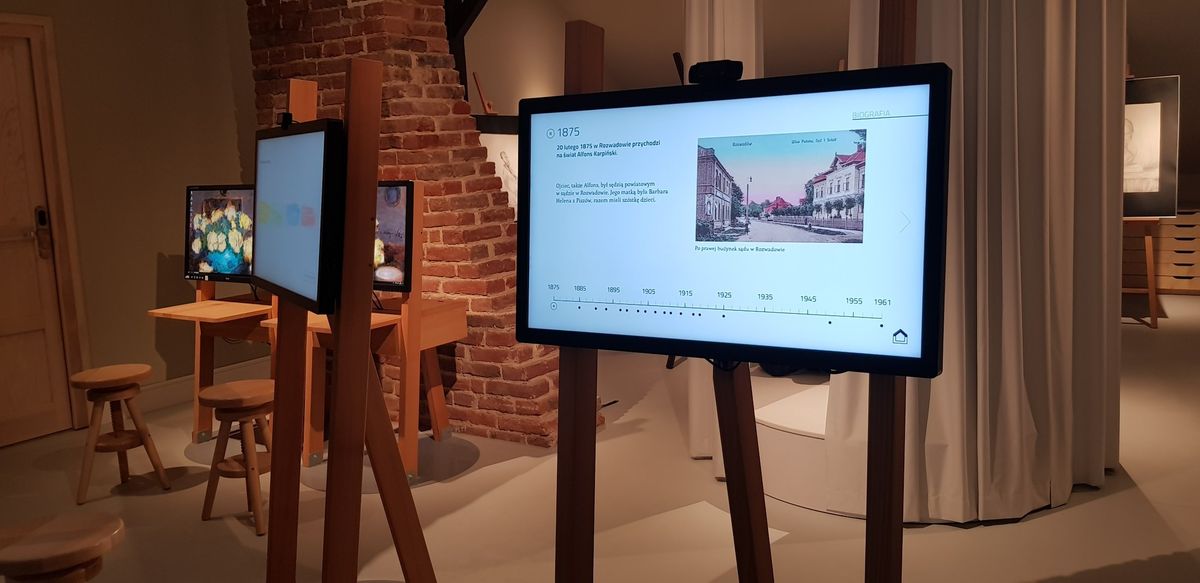
- Several dozen applications rewritten: the interactive applications were rewritten in modern, stable technologies that ensure smooth performance and compatibility with the new system.
- Managed without developers: a CMS module and configurator let museum staff edit content, graphics, text and application settings on their own.
Visitor behavior analytics
- Interaction maps: the module records how visitors navigate the application structure, making it possible to analyze the sequence of their choices.
- Engagement statistics: reports show content popularity, time spent at screens and the points where users abandon the interaction.
Lighting management and exhibition automation
- Automation: staff can start up and shut down the entire exhibition, including AV equipment, applications and lighting scenes, on schedules or with a single click.
- Technical monitoring: real-time device monitoring helps detect hardware anomalies immediately.
Benefits for the museum
- Operational continuity: a deep modernization was completed without closing the exhibition.
- Autonomy and savings: the museum team can update the exhibition in-house.
- Data-driven optimization: interaction analytics supports curatorial and educational decisions.
- A single point of control: integrating multimedia, applications, audio and lighting simplifies the building’s day-to-day technical operation.